Overview
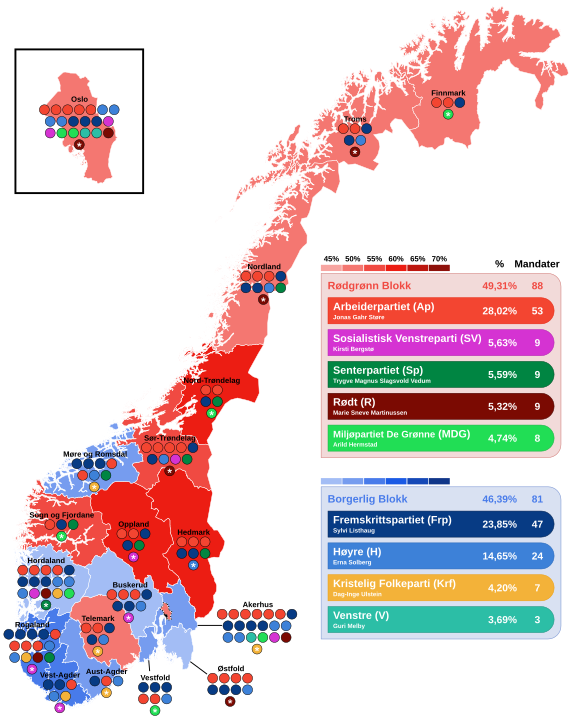
The Fremskrittspartiet (FrP), Norway’s right-wing Progress Party, has been a polarizing force in politics for decades. From its humble beginnings to its recent surge in 2025, FrP’s electoral performance offers an interesting glimpse into voter behavior and political trends in Norway. Using a dataset of parliamentary (Stortinget), county (Fylke), and municipal (Kommune) elections (1973–2025) and polls (2010–2025) adopted from pollofpolls.no, I’ve analyzed FrP’s highs, lows, and other things in between. (the following image was taken from Wikipedia, see the caption for attribute)

The Data: A Snapshot
- Parliamentary Elections: 14 records (1973–2025), with support ranging from 1.9% to 23.8%.
- Local Elections: 26 records (1975–2023), split between county (1.4%–18.5%) and municipal (0.8%–17.5%) elections.
- Polling Data: 144 records (Jan 2010–Sep 2025), fluctuating between 8.2% and 24.6%.
FrP’s Electoral Performance
FrP performs best in parliamentary elections, averaging 12.6% support, compared to 10.35% in county elections and 9.38% in municipal ones. The party’s parliamentary results are also the most volatile, with a standard deviation of 7.4%, reflecting bigger swings in voter support compared to local elections (volatility of 4.06% for county, 3.51% for municipal).
| Election Type | Mean Support | Median | Volatility | Min | Max |
|---|---|---|---|---|---|
| Parliament | 12.60% | 13.8% | 6.21% | 1.9% | 23.8% |
| County | 10.35% | 11.8% | 4.06% | 1.4% | 18.5% |
| Municipal | 9.38% | 10.4% | 3.51% | 0.8% | 17.5% |
FrP’s strongest support came from smaller, often coastal or rural municipalities. The top five municipalities by vote share were:
| Municipality | Vote Share (%) | Total FrP Votes |
|---|---|---|
| Herøy | 44.3 | 2,290 |
| Austevoll | 41.1 | 1,271 |
| Vanylven | 40.9 | 789 |
| Sula | 39.5 | 2,143 |
| Karmøy | 39.2 | 9,782 |
These top five municipalities are all located in Western or Southern Norway. These areas, often characterized by fishing, agriculture, and smaller populations, have historically leaned toward FrP’s policies on deregulation, local autonomy, and opposition to centralized control.
Why the stronger showing in national elections? FrP’s platform likely resonates more in high-stakes parliamentary races, where national issues like immigration and taxes take center stage.
Consistency Across Elections
The data shows a strong correlation between election types. County and municipal results are nearly identical (correlation of 0.997), while parliamentary results align closely with both (0.824–0.853). This suggests FrP’s voter base is rather consistent, whether casting ballots for local councils or the national parliament.


Electoral Phases: From Fringe to Force
FrP’s parliamentary journey can be split into three distinct phases:
- Marginal (< 5%): 1977–1985, averaging 3.37%. These were FrP’s early, scrappy years, struggling to break through.
- Moderate (5–15%): 1973, 1989, 1993, 2001, 2021, averaging 10.12%. A period of steady growth and consolidation.
- Strong (> 15%): 1997, 2005–2017, 2025, averaging 19.28%, peaking at 23.8% in 2025.

The 2025 result is particularly striking, marking a return to form after a dip in 2021 (11.7%).

Polling Insights: A Rollercoaster Ride
From 2010 to 2025, polls show FrP’s support averaging 15%, with a high of 24.6% (Feb 2025) and a low of 8.2% (Jul 2019). Volatility is moderate (standard deviation of 3.9%), and recent polls indicate a 4.5-point uptick in the last 12 surveys. However, the overall trend since 2010 slopes slightly downward (-0.029% per month), a statistically significant shift (p-value 0.0001). This suggests short-term gains but potential long-term challenges.

Can Polls Predict FrP’s Success?
Polls have consistently underestimated FrP’s parliamentary performance. Comparing poll averages to actual results (2013–2025), the average error is 1.41%, with polls underpredicting every time:

This underestimation could stem from social desirability bias (voters hesitant to admit supporting FrP) or methodological issues with the polling system.
Conclusion
The Progress Party has grown from a relatively marginal presence to a key player, especially in parliamentary elections. Its consisent voter base, recent strong electoral performances, and polling trends reveal a nuanced and sometimes surprising dynamic. Notably, polls often seem to underestimate FrP, which may point to either methodological issues or the party’s distinctive appeal at election times.
In summary, FrP’s journey highlights the challenges a party faces when transitioning from protest politics to holding power. The party’s peak support aligns with moments of clear ideological messaging and firm opposition. On the other hand, periods of moderation, such as the internal purge in 2001, or participation in government from 2013 to 2020, even when key policy objectives were achieved, triggered notable electoral setbacks as some supporters temporarily drifted away.

